

The Shedd Aquarium required assistence in improving user flow after noticing a pattern of frustrated users during ticket checkouts for events. The team reported high reports of frustrated calls to the Shedd's customer service due to confusion towards program offerings and clarity on how final pricing is determined.
Our team set out to find the usability problems behind that frustration, make buying event and program tickets easier, and reduce checkout-related calls to customer service.
4 Person Design & Research Team
January 2025 - May 2025
Prototype Delivered
I led UI design as the primary visual designer and collaborated on UX research and user testing on this project, working alongside fellow UI/UX consultants from Pratt's Center for Digital Experiences.
The team created a research plan that aligned with Shedd's goal of reducing user frustration during the events and programs checkout. We focused on what pain points in the user flow causes this frustration in the first place.
Identify and improve friction points for users to complete purchases independently and confidently.
Three methods captured different parts of the problem: what users did, where they looked, and how they felt afterward.
User Trends Analysis
Review behavior and traffic patterns in Shedd’s Google Analytics.
Eye tracking using Tobii Lab Pro
Heat maps show where attention gathers and which elements pull focus from key decisions.
System Usability Scale (SUS) Questionnaire
Captures how confident users felt and where they felt uncertain.
Our center is in NYC, so our participants were unlike Shedd’s typical Chicago-area and tourist visitors. To get closer to that audience, we recruited people who regularly visit comparable cultural institutions and had experience buying from public institutions.
Testing period
4 weeks
Testing sessions included
13 Participants
The results from each method used during research revealed another part in the understanding of what frustrates users during the checkout process.
Average of daily visits to Shedd homepage
Users convert to making final purchases from Program & Events
With only a 17% conversion rate of visitors going on to purchase tickets from Events & Programs, that gap suggests the site is good at attracting visitors, but UX problems keep many of them from completing a purchase.
Attention clustered heavily on program descriptions as users tried to orient themselves before they could find what they wanted.

The cart progress bar gave no sign of reservation status or upcoming costs, and add-ons showed up without context. Users who had mentally settled on a price were surprised by a different total at checkout.

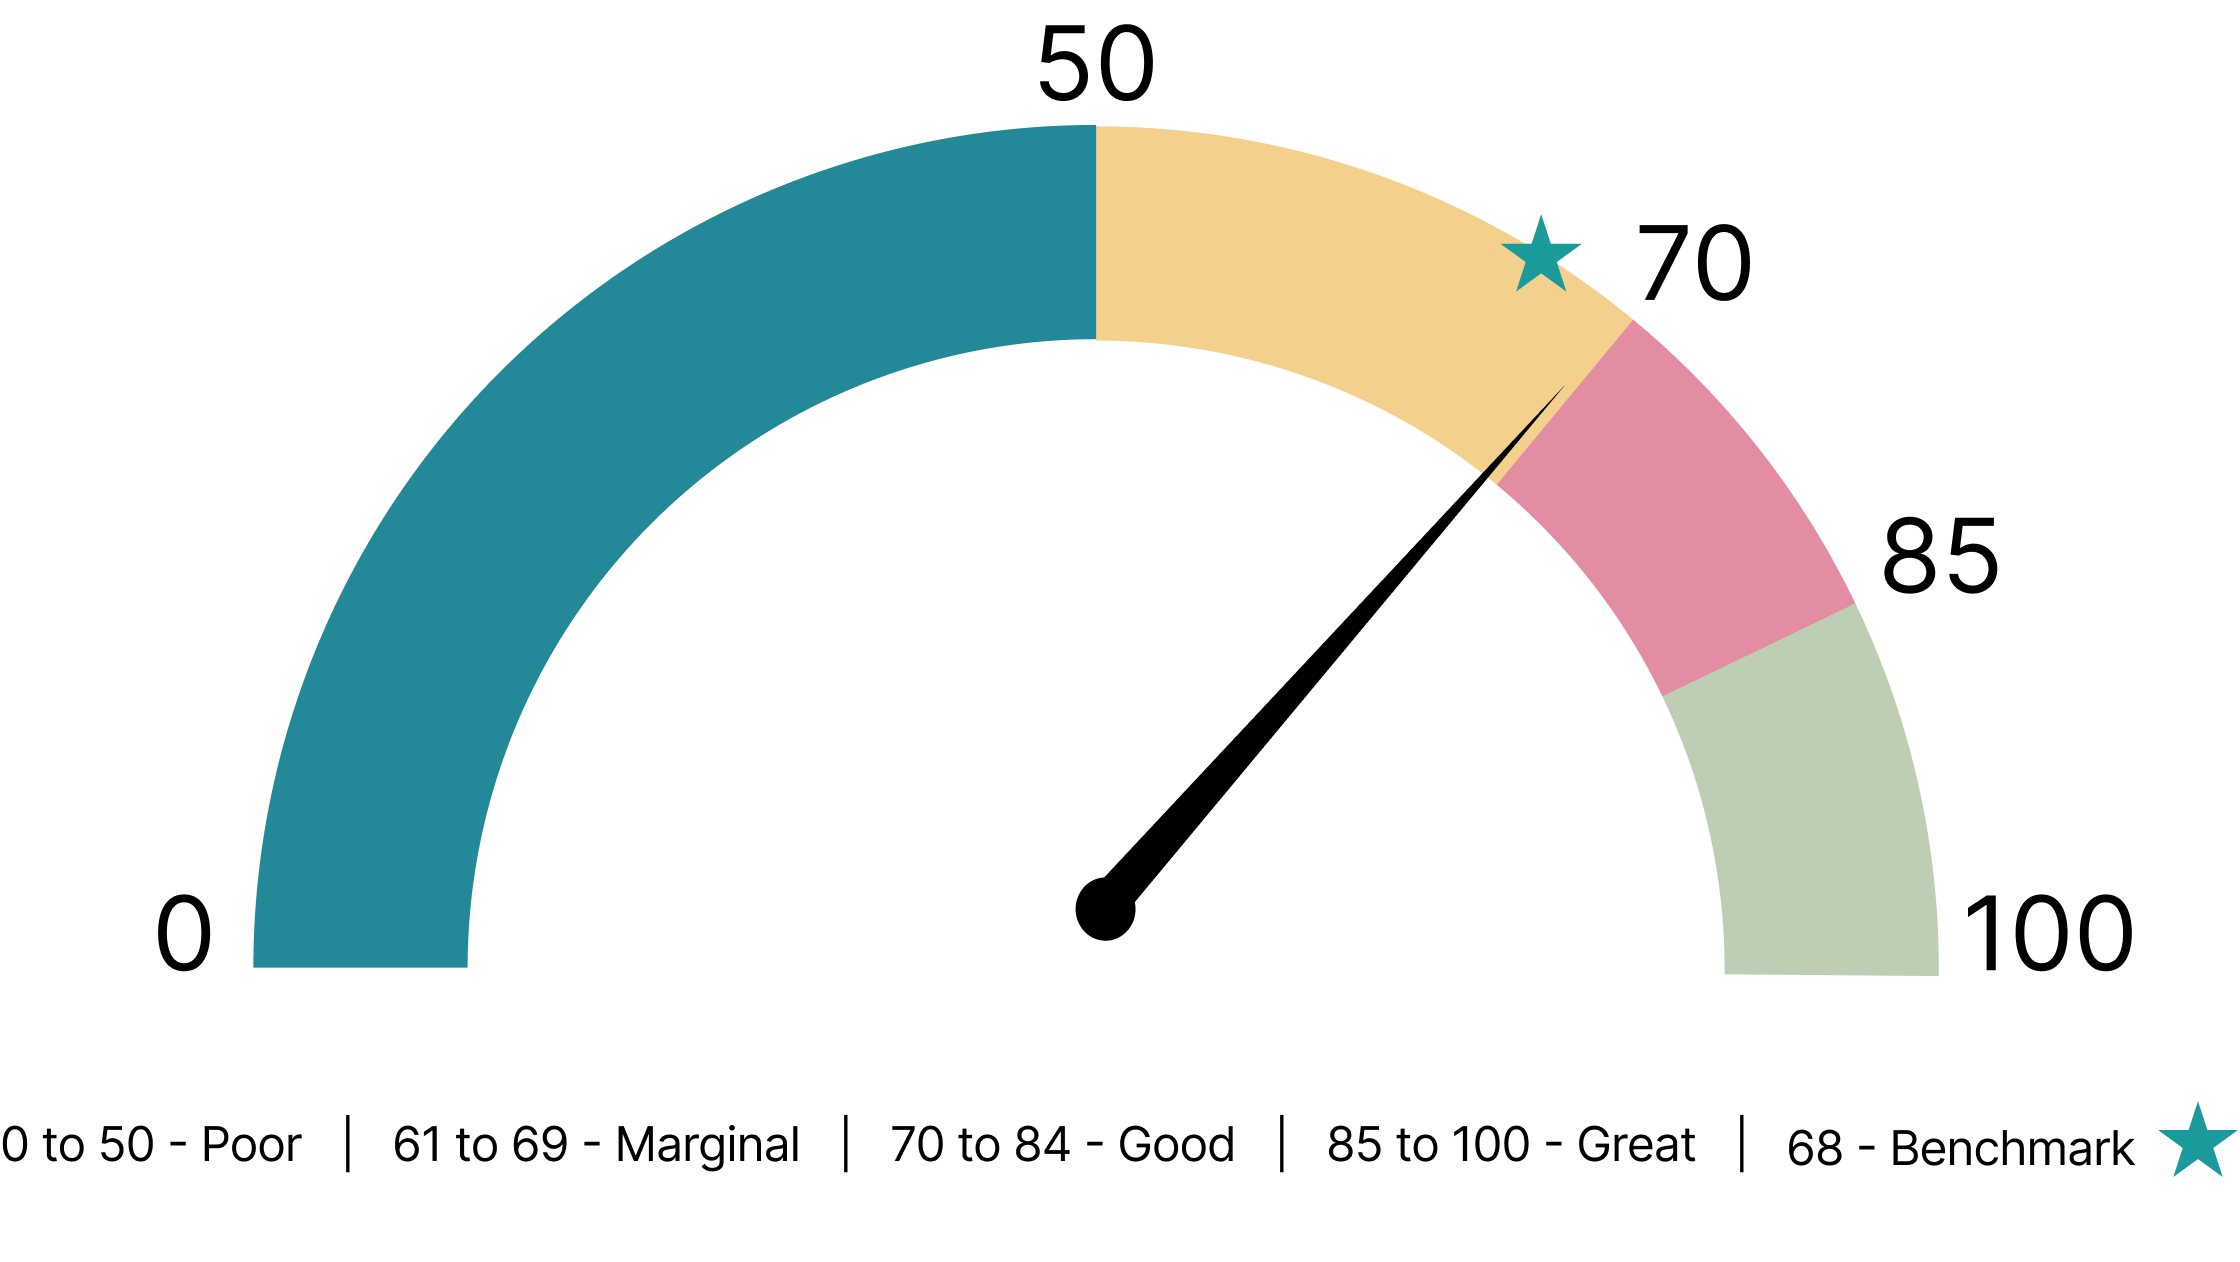
The SUS is a standardized ten-item questionnaire that measures how usable a product feels. Our participants gave the flow a score of 69.6/100, just above the commonly cited average of 68. In practice, the flow works, but it leaves clear room for improvement.
Unclear Offering & Pricing
Users couldn’t tell what each event included or what would cost extra, for example whether general admission was part of an event.
Late-Stage Pricing Surprises
The total changed sharply during checkout, which caused confusion and frustration.
The redesigned checkout experience was delivered directly to the Shedd Aquarium, addressing the friction points uncovered through eye tracking and user testing. It uses clearer program headers, transparent pricing, and a streamlined flow built to support confident purchasing.
We rewrote program headers so each offering is immediately clear. We added value badges that show add-on costs and inclusions up front, so users can make an informed choice before committing to a path. Presenting the right information at the right moment reduces the effort of comparing options.

We added a step-by-step progress sidebar so users always know where they are in the flow. A real-time cost breakdown updates as users make selections, so the final price is never a surprise. Users always know what they’re committing to and why.

Small language and layout decisions carry enormous weight, and what feels intuitive to an organization can be a dead end for a user. Eye tracking made those problems visible by showing attention patterns and hesitation that users couldn’t always put into words. Paired with self-reported feedback, that behavioral data showed both the what and the why: checkout friction came from unclear information and weak feedback during checkout, which led to distrust. Once a user feels misled about cost, they start questioning everything else in the flow.